
featured insight
featured insight

Six Ways of Looking at the 2020 Presidential Election
New polling data and analysis from Meeting Street give deeper insights into the 2020 Presidential Election
Beyond the horserace polling, there are other data points that provide a more complete understanding of the Presidential race. We wanted to take a closer look at some of these.
Six factors to consider are (1) ballot test polling over time, (2) Presidential approval rating, (3) the issues voters say are most important, (4) economic data, (5) demographic shifts, and (6) non-voters in 2016. The interplay of these factors present a more complete view of the current Presidential race than national polling numbers alone.
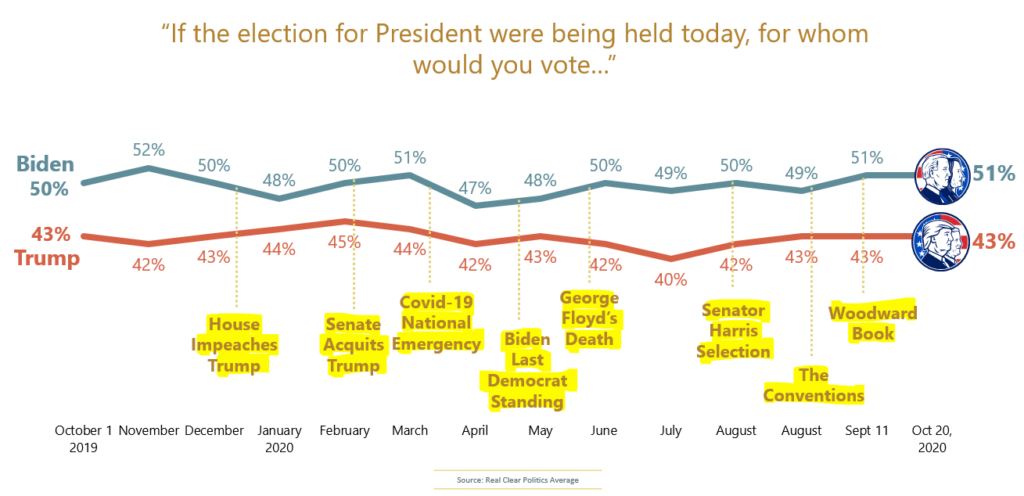
The Ballot Has Been Remarkably Stable Over the Past Year
People who have been watching the Presidential race closely might have noticed that overall, it’s been an extremely stable race. Since October of 2019, Biden has consistently polled between 47% and 52% while Trump has consistently been between 40% and 45%.1
This steadiness in polling comes despite a lot of major news events, including Impeachment and COVID-19.
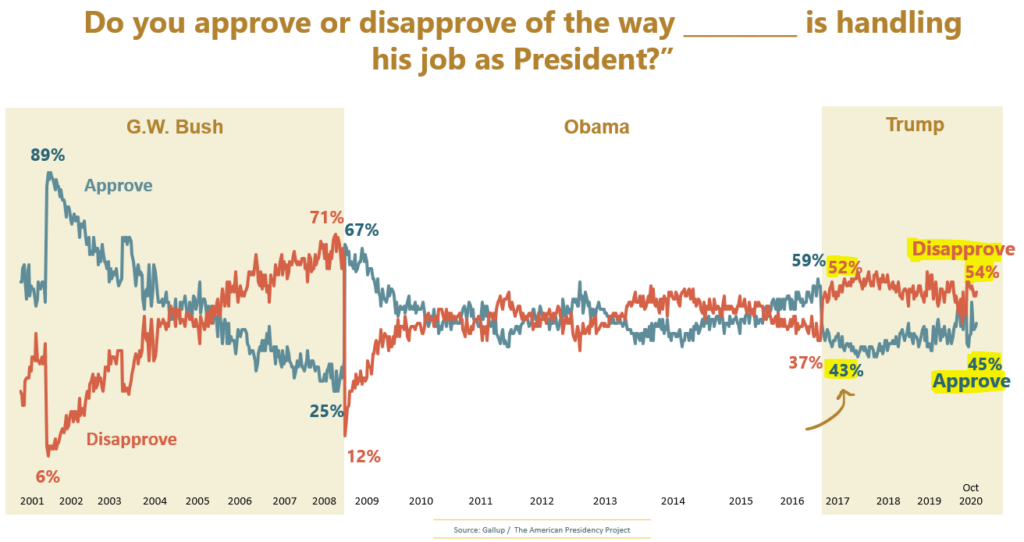
The President’s Approval Rating Has Been a Good Predictor of Votes
President Trump’s approval rating has been remarkably stable. While other presidents enjoyed a “honeymoon” period shortly after being elected—a time when their approval ratings were high—Trump did not experience a similar boost at the beginning of his term.
At the beginning of his presidency, Trump had a 43% approval rating (52% disapproval rating). Today, it stands at 45% (54% disapproval rating).2
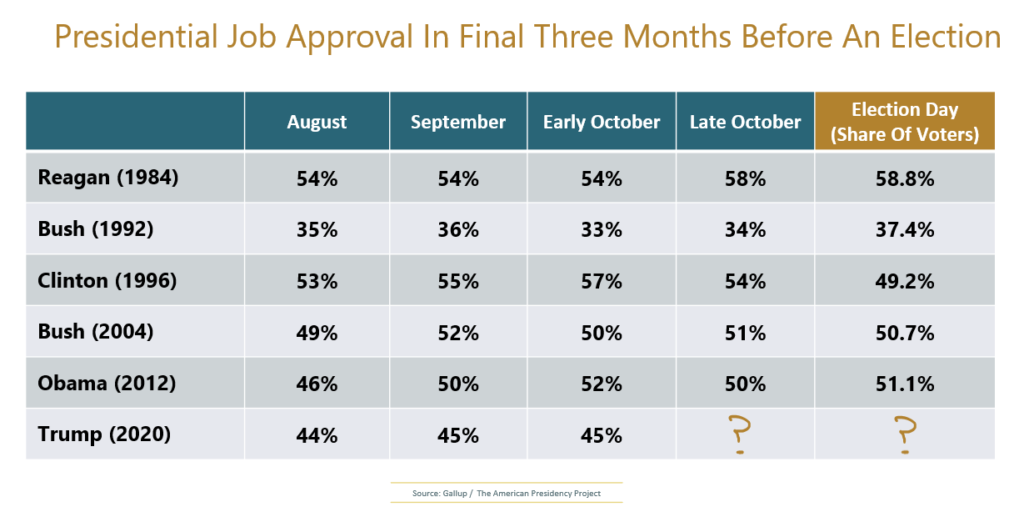
This is important polling to watch, because so far, the President’s approval rating in late October has been a very good predictor of how many votes he will receive on Election Day.3
If the President’s job approval number continues to hold at 45% or above, it does suggest this true ballot score might be a couple points higher than the national poll averages currently are suggesting (43%).
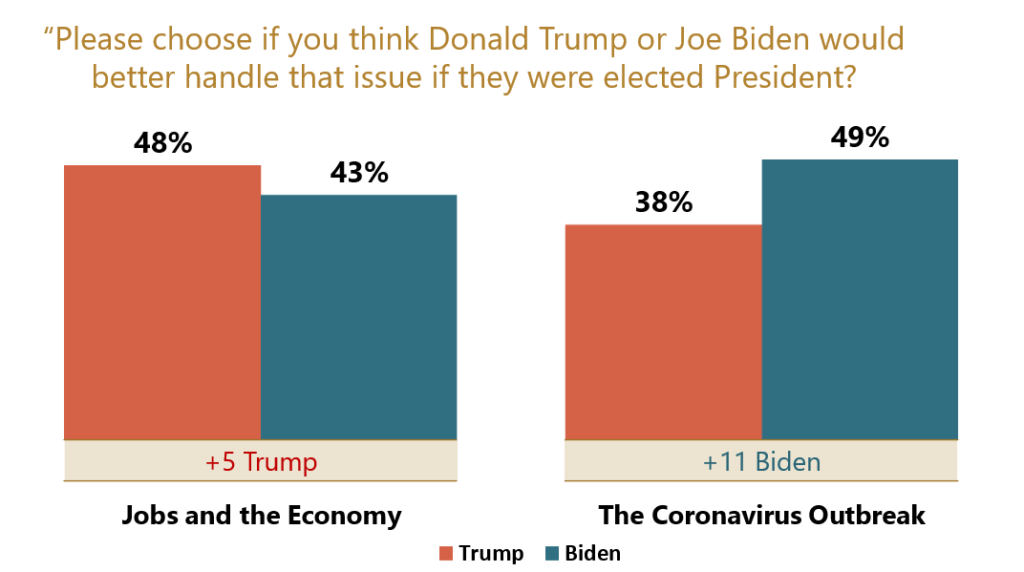
Voters Pick Biden on the Pandemic and Trump on Jobs and the Economy
The COVID-19 outbreak is the most important issue for voters, with 60% stating that it is “extremely important” to their Presidential vote. Jobs and the economy (55%) was second, and health care (53%) was third.
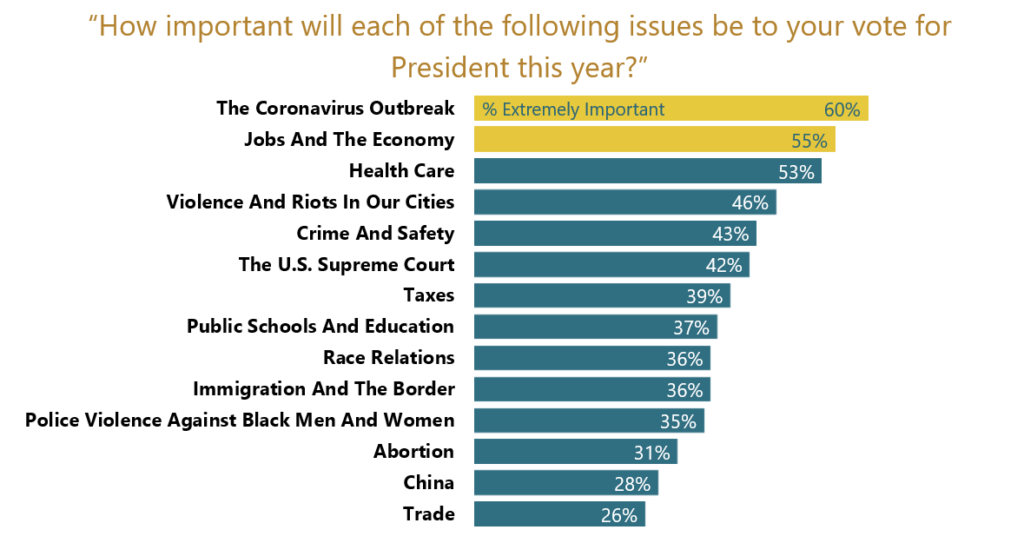
Looking at polling for the top two issues, voters think that Trump would better handle jobs and the economy. Biden is the preferred choice on the pandemic.
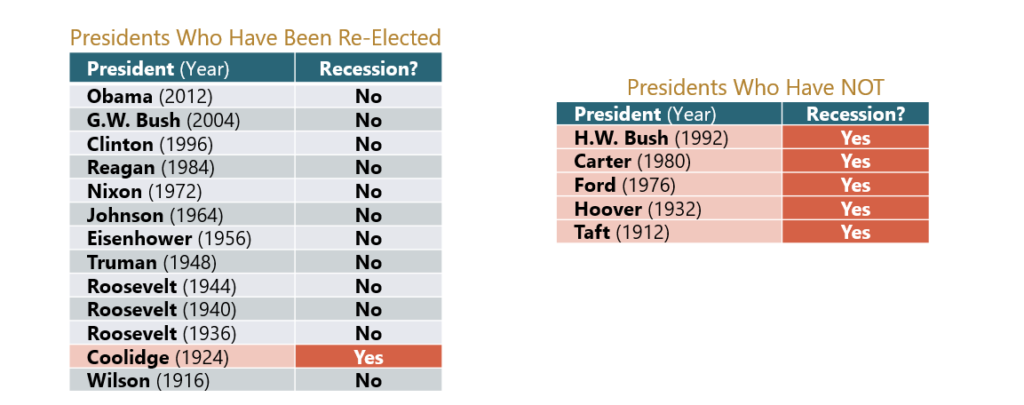
Despite Voters Preferring Trump on the Economy, Current Economic Numbers Don’t Bode Well For The Trump Campaign
Throughout history, incumbent Presidents have not fared well during recessions. In fact, only one Presidential candidate has ever been re-elected during a recession: Coolidge in 1924.
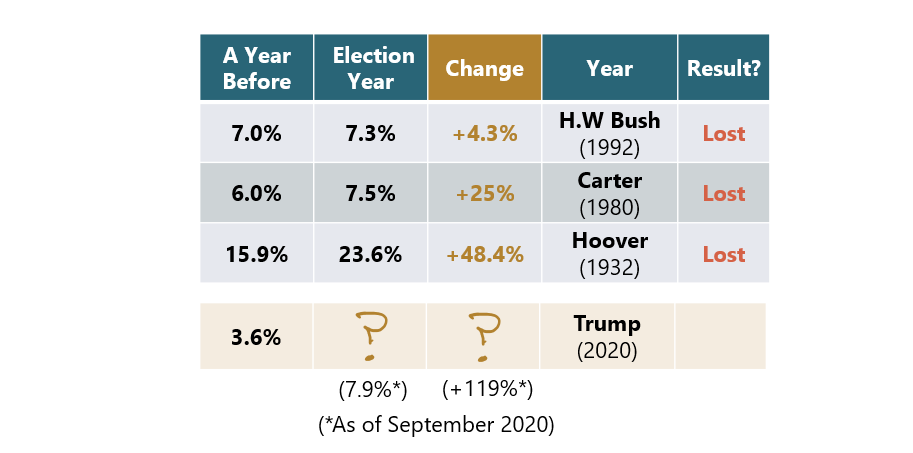
Unemployment data is another predictor of Presidential elections. Since 1932, there have only been three times where the unemployment rate was higher on Election Day than it was the year before. In all three cases, the incumbent President lost. While we do not know the unemployment numbers this election year, we do know it is likely it will be higher than 2019, which historically has been a bad sign for the incumbent President.4
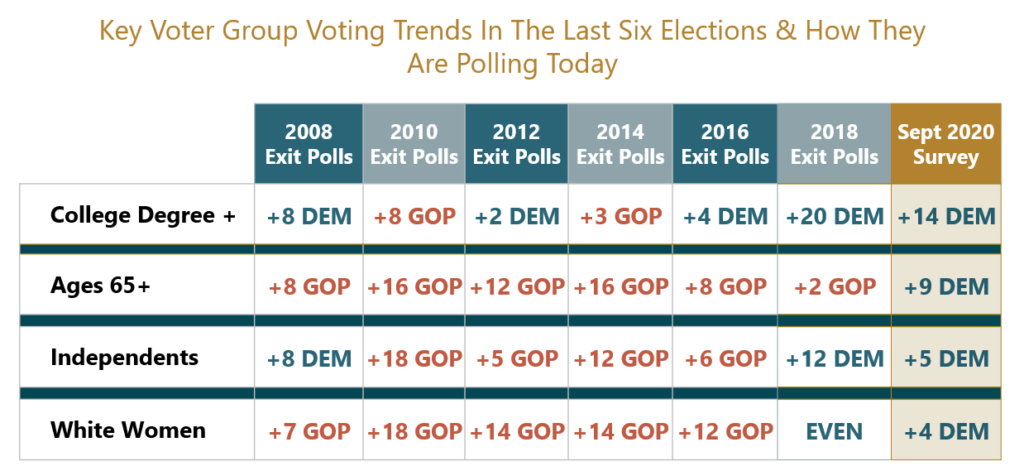
Key Demographics Appear to be Trending Toward Democrats
Based on our own September research, there are four key demographic groups that are trending toward Biden compared to 2016. When compared to exit polls over the last 10 years, the trend is toward the democratic nominee.
Since the last Presidential election (2016), voters with college degrees, seniors, Independents, and white women have all swung toward the Democrats in a major way.
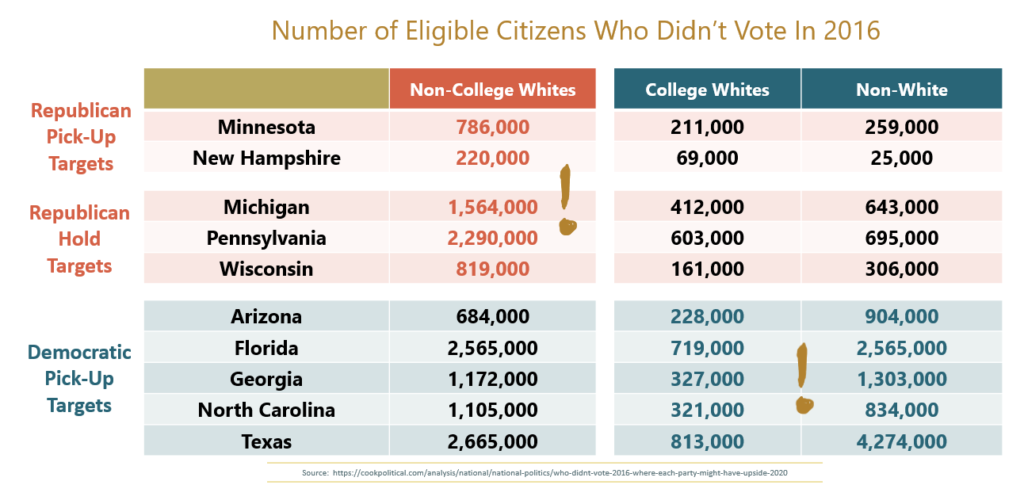
Both Campaigns Do Have Opportunities To Pick Up New Voters in Key Swing States
There are opportunities for Democrats and Republicans to pick up voters compared to 2016. One of the ways of doing this is to persuade eligible voters who didn’t vote in 2016 to vote in this election.
In Pennsylvania, for example, almost 2.3 million white voters without a college degree (a group that leans Republican) didn’t vote in 2016. Considering that the 2016 Presidential election was decided by 44,292 votes (out of more than 6 million), this block of voters could provide a lift to Trump’s campaign if they can find a way to reach them.
Biden, on the other hand, has a lot of room to grow in Arizona, Florida, Georgia, North Carolina, and Texas by turning out non-whites and college-educated whites, two groups that lean Democrat.5
There are still many unknowns in the race, but what we do know suggests the Trump campaign has its work cut out for it in the closing days of the election.
Meeting Street Insights conducted an online national survey of registered voters (N=800). The study was conducted September 21–24, 2020.
What do you need to know? We can help. Get in touch or subscribe to our newsletter.
